Tool 01 — The Retirement Stress Test
Would your plan survive a bad first five years?
The same model we run on the show — with a worked example pre-loaded and a column for your own numbers. Three Social Security strategies, a deliberately bad market, and the spending number that decides everything.
The first tool in a growing kit. Every tool we publish is the same model we used on air — never a lite version.

What you get
What’s inside
Three claiming strategies, side by side.
Both claim at 62. Both wait for 67. Or the split: the higher earner delays to 70. The same table our episodes use — for your household.
A deliberately bad first five years.
Minus 20%, minus 8%, then a slow recovery — a deliberately bad stress path, applied to your balances. Not a forecast. A test.
The $667 sensitivity table.
See what one number — monthly lifestyle spending — does to the year the money runs out. This is the finding that decides most verdicts.
A flexible-spending guardrail.
Toggle one rule — spend $6,000 less the year after a bad market — and watch what pre-committed flexibility is worth.
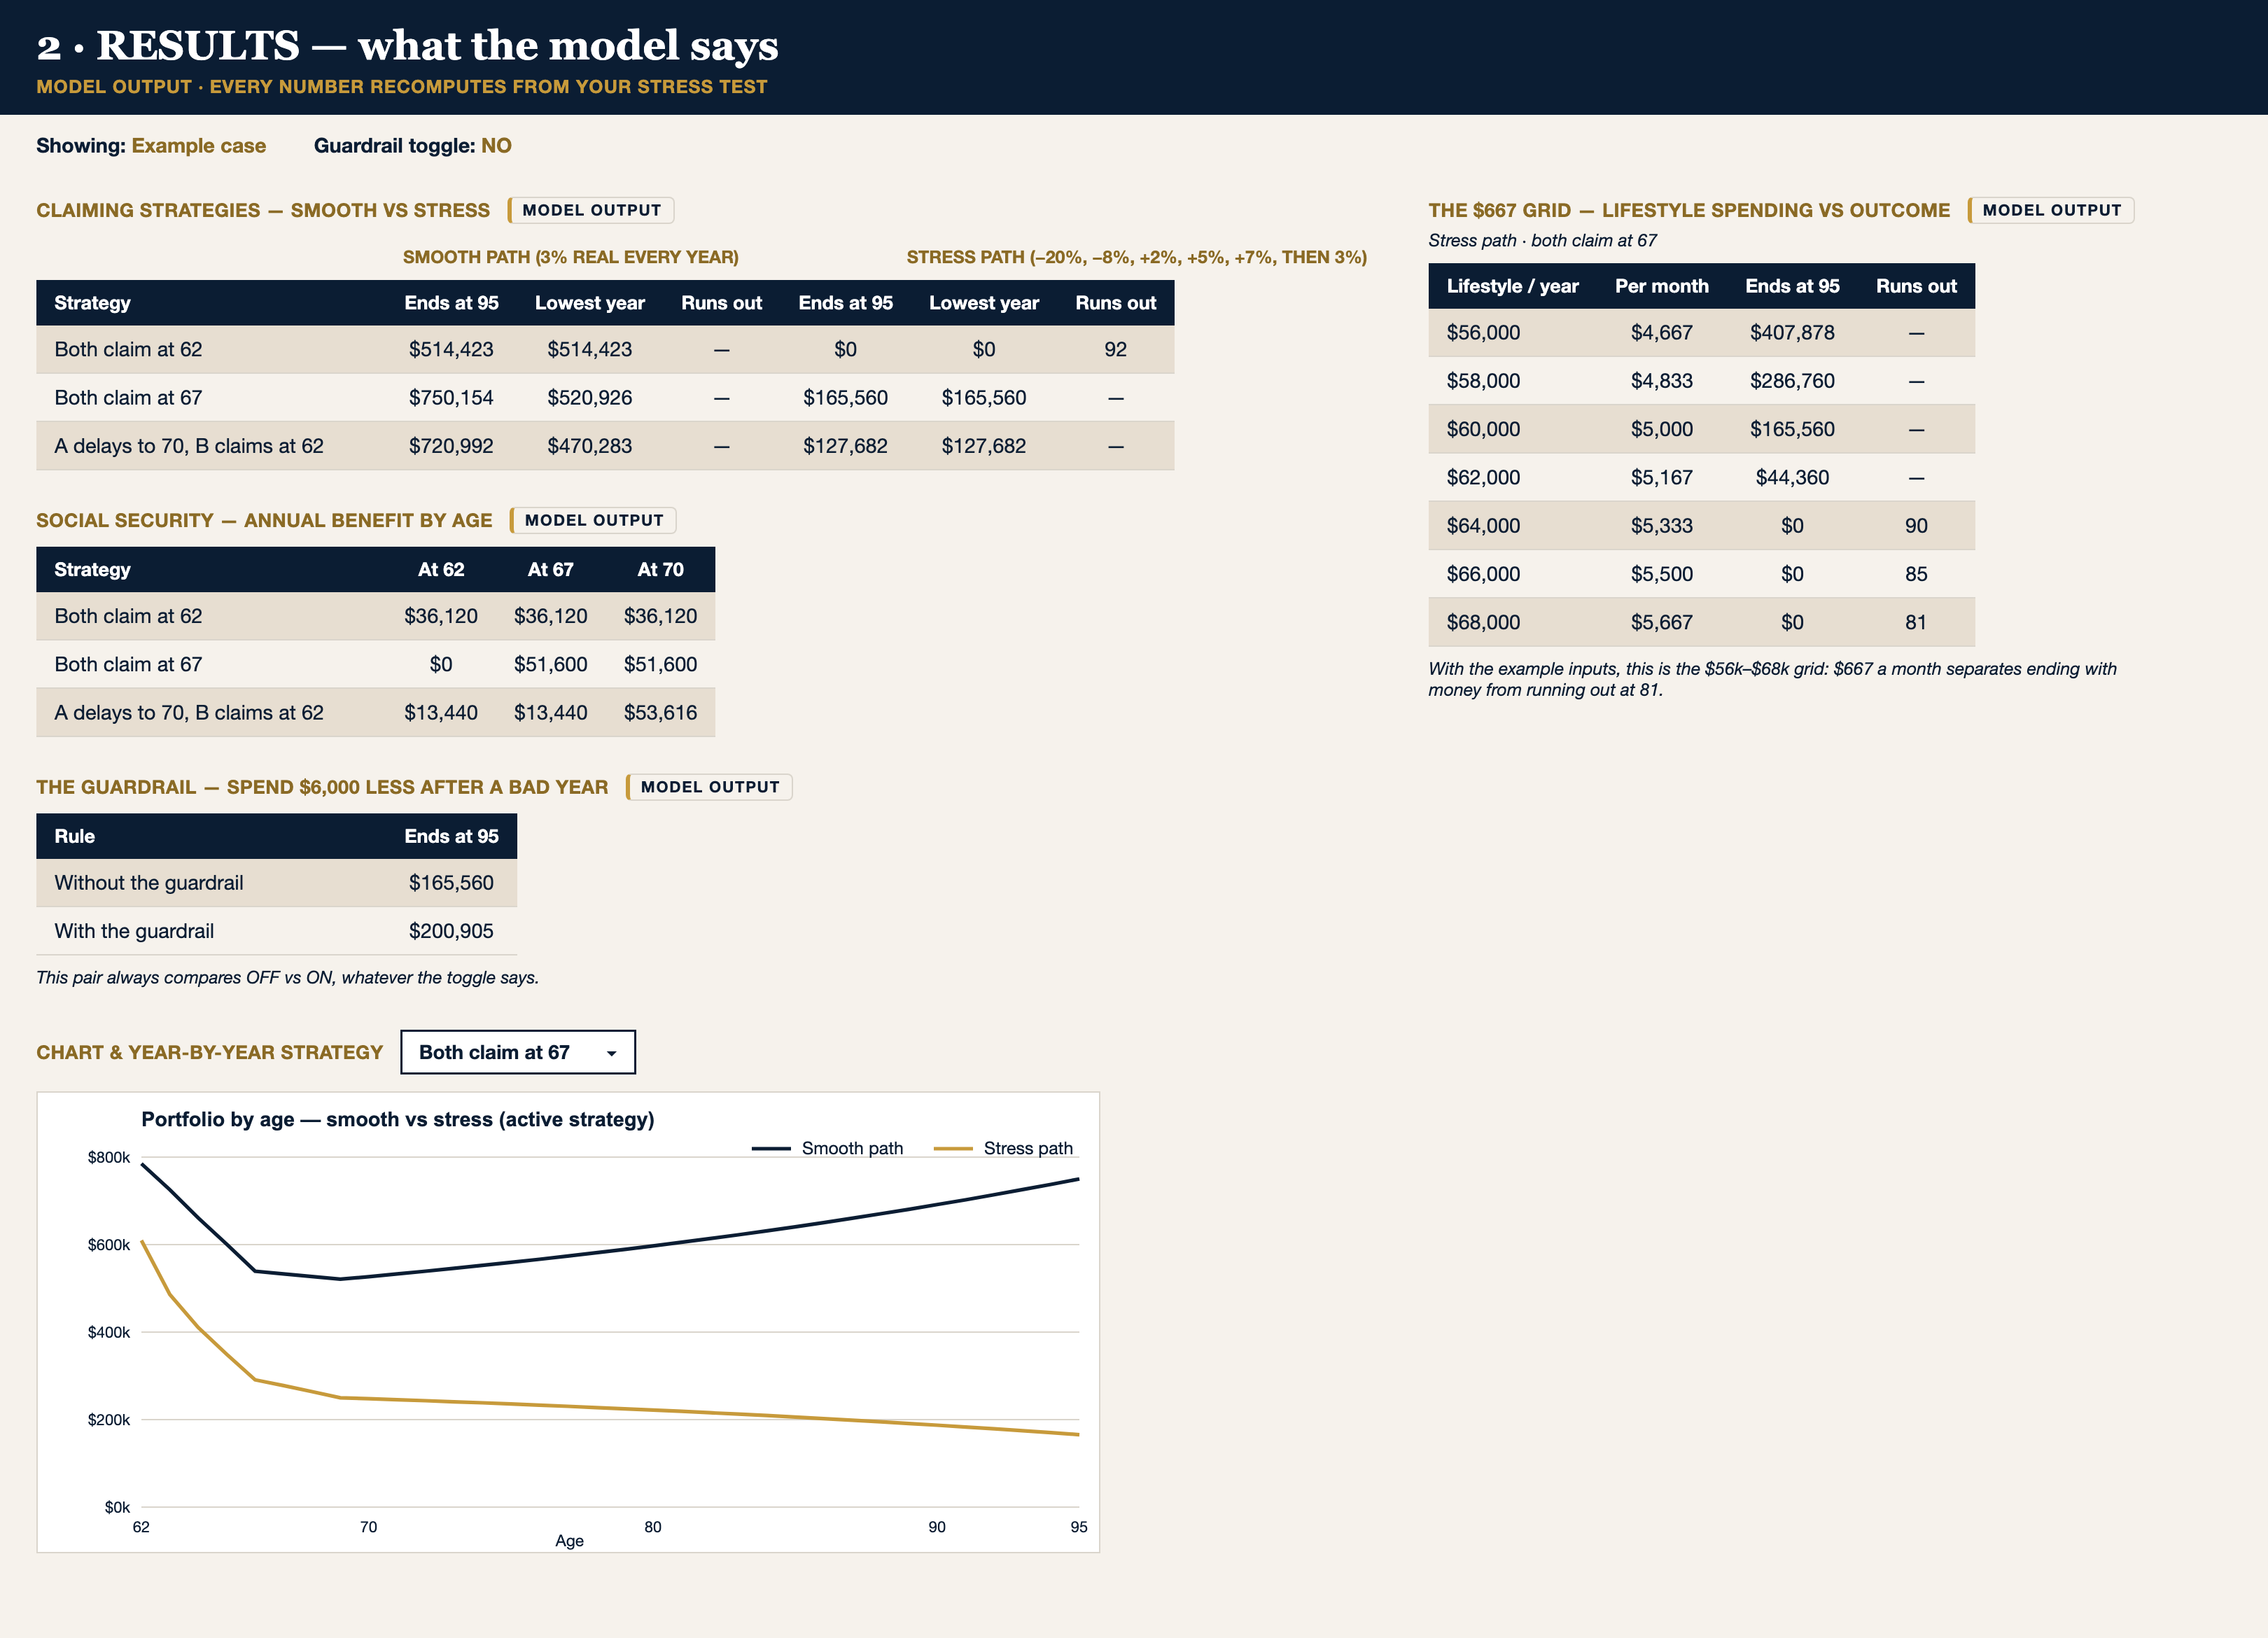
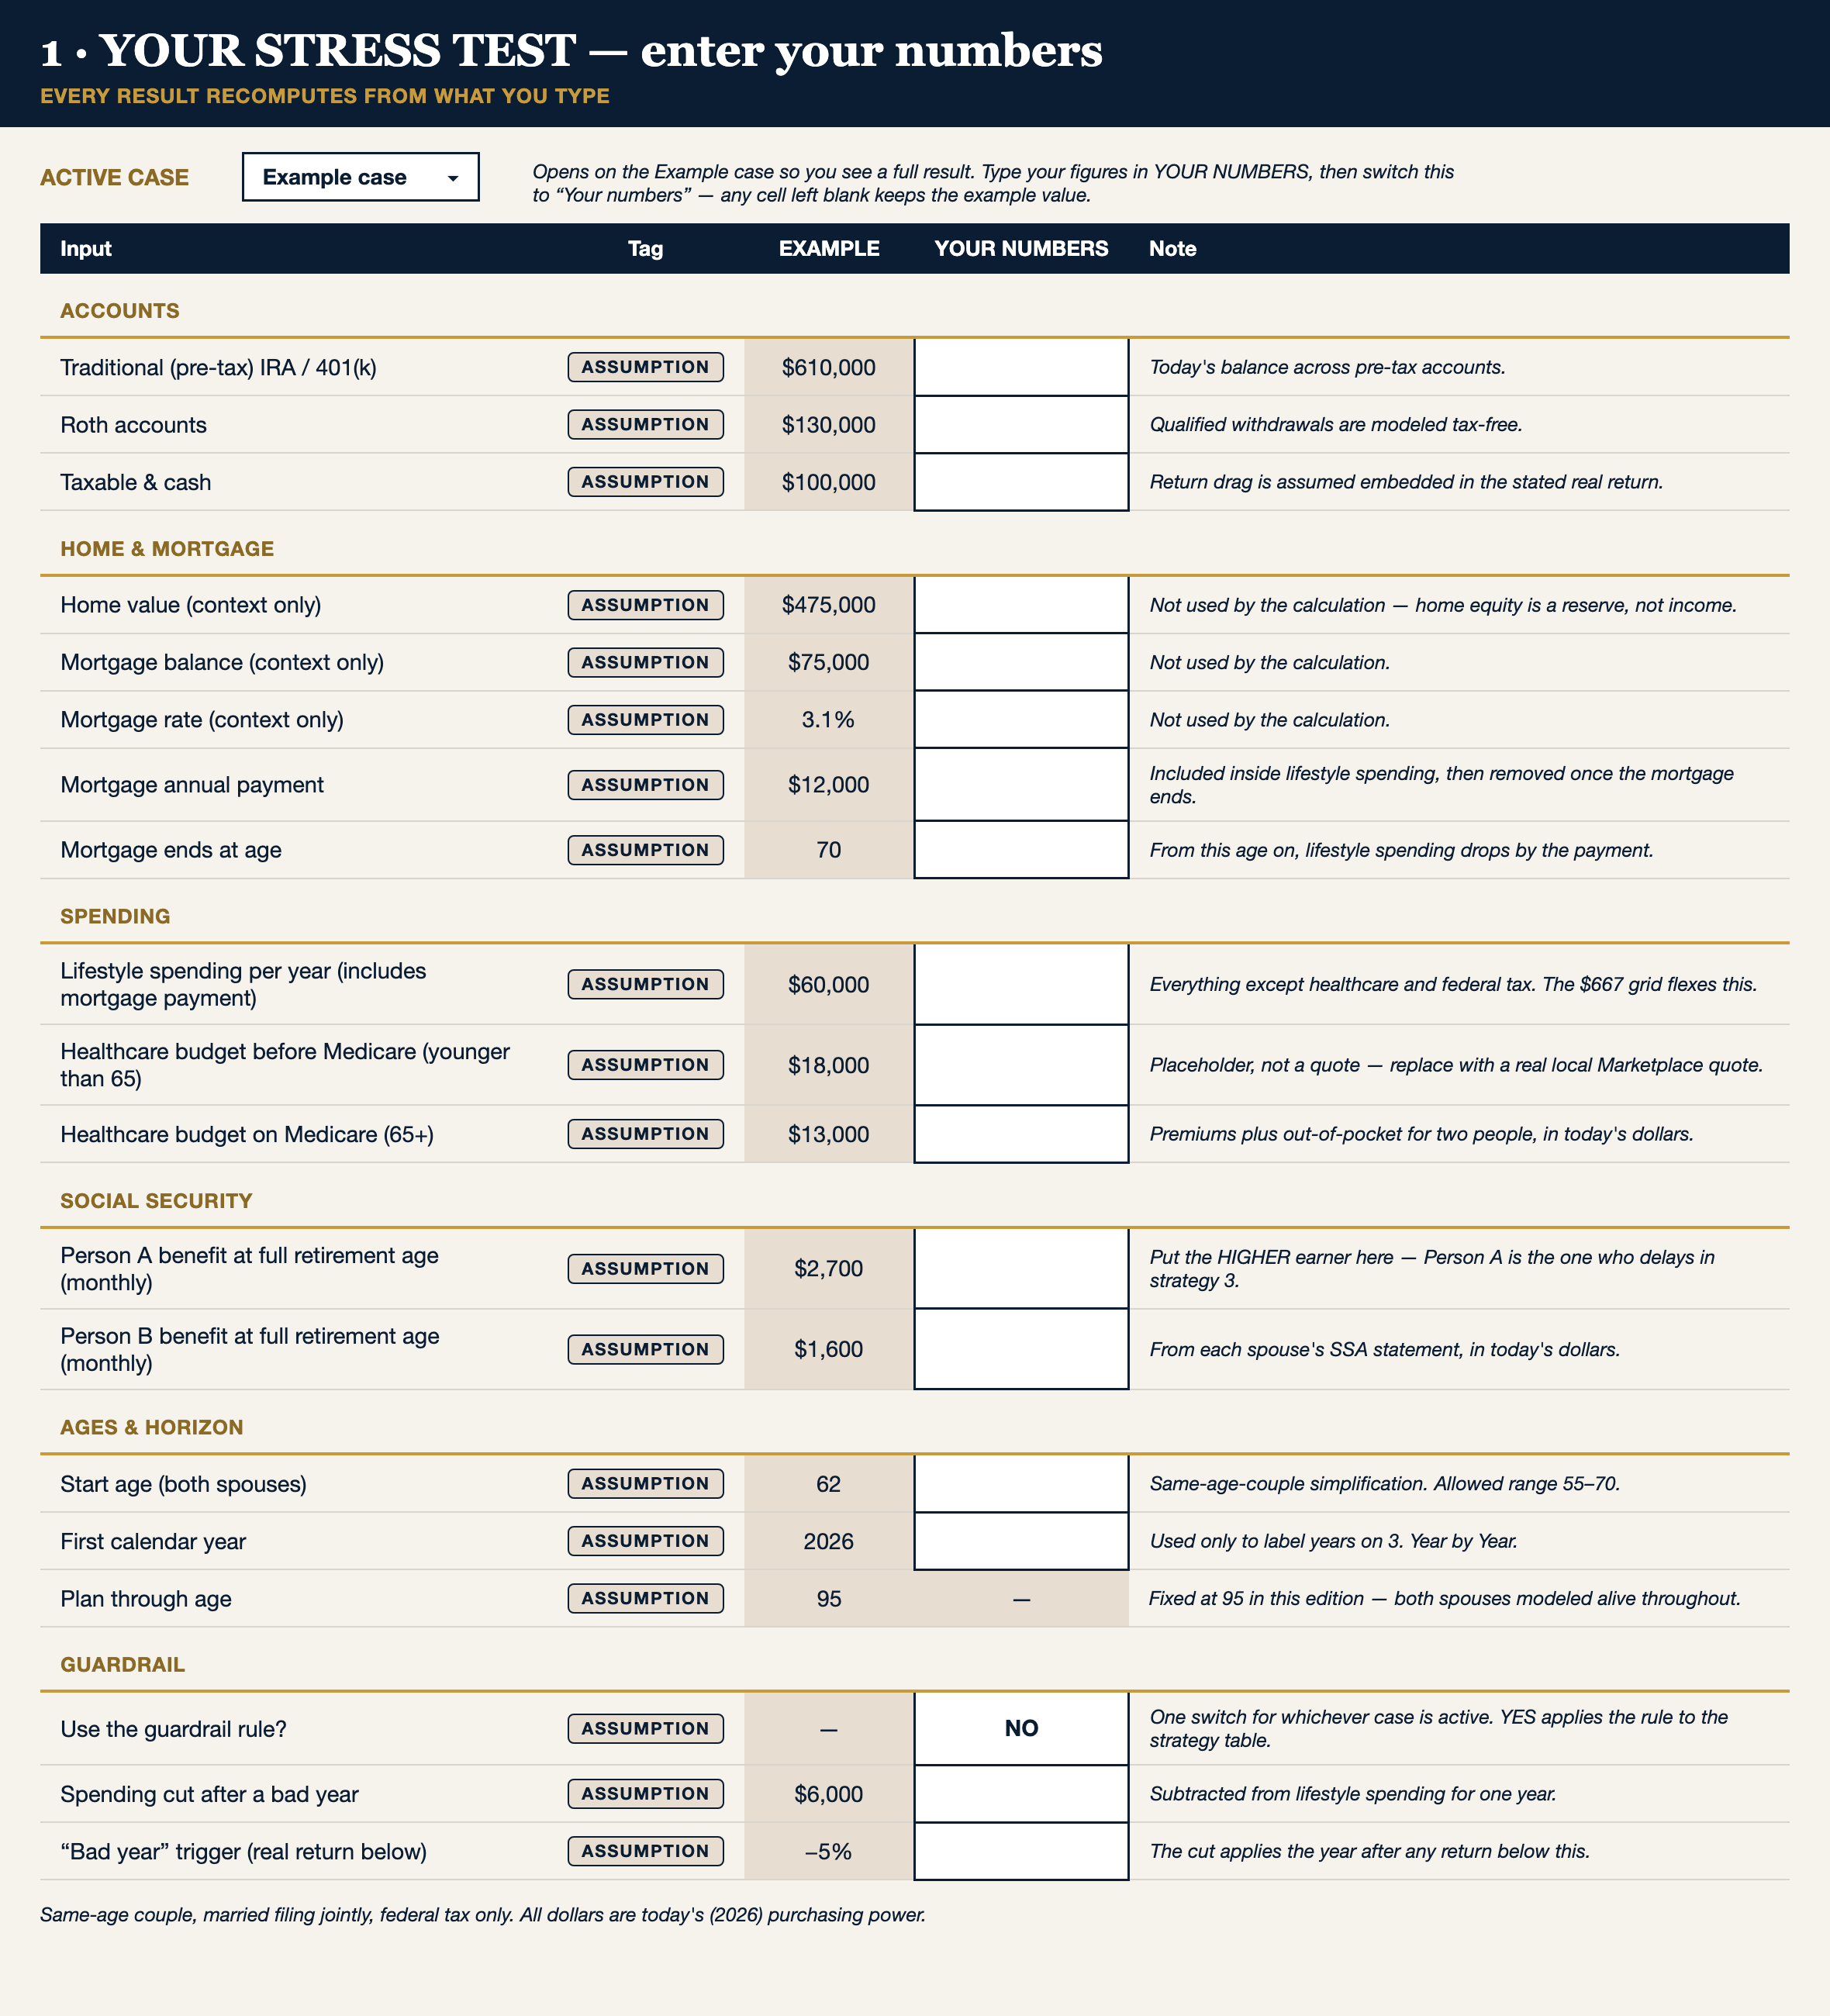
Every input is labeled FACT or ASSUMPTION. Every result is labeled MODEL OUTPUT. The engine is open — every formula inspectable, nothing hidden.
The finding
The margin that decides retirement isn’t the balance. It’s $667 a month.
Under the same stress path and the same claiming strategy, the worked example’s outcome at 95 swings from about $166,000 remaining to running out at 81 — on a spending difference of $8,000 a year. That’s $667 a month. The Stress Test shows you the same table for your own numbers.
| Lifestyle spending | Outcome on the stress path |
|---|---|
| $60,000 a year | About $166,000 left at age 95 |
| $62,000 a year | About $44,000 left at age 95 |
| $64,000 a year | Money runs out around age 90 |
| $68,000 a year | Money runs out around age 81 |
MODEL OUTPUTSame portfolio, same market path, same claiming strategy. The only change is spending.
Run your own numbers
Your Three Numbers
A viral claim online says one threshold decides when saving more stops mattering. It measures momentum, not whether your life is funded. Enter your own numbers below and see all three — including the one that actually decides.
Number one
Growth matches your saving
$250,000
$10,000 ÷ 4% = $250,000
Below this line, your own saving does most of the work. Above it, an average year’s growth adds more than you do.
Number two
The viral momentum number
$750,000
3 × $10,000 ÷ 4% = $750,000
This is the number behind most “once you cross this, saving barely matters” claims online. It measures momentum, not whether your life is actually funded.
Number three
The number that decides
$60,000 spending − $24,000 guaranteed income = $36,000 gap
$36,000 ÷ 3.9% (× 25.6 of your gap) = $923,077
Lazy napkin
$923,077
Gap × 25.6, done. Ignores when your guaranteed income actually starts, healthcare before Medicare, and taxes.
Honest napkin
$1,330,122
Adds the 5 years before guaranteed income starts — full spending, healthcare, and the tax on withdrawing it.
| Bridge phase | Years | Healthcare / yr | Withdrawal needed / yr | Subtotal |
|---|---|---|---|---|
| Before Medicare eligibility (age 65), age 62–64 | 3 | $18,000 | $83,682 | $251,045 |
| Medicare-eligible, before guaranteed income starts, age 65–66 | 2 | $13,000 | $78,000 | $156,000 |
| Bridge total | $407,045 | |||
| After income starts, age 67+ — $36,000 gap ÷ 3.9% | $923,077 | |||
| Honest total | $1,330,122 |
Same spending every year; healthcare and the tax gross-up are the only bridge-year adders. The withdrawal needed is grossed up for 2026 federal tax (married-filing-jointly brackets, standard deduction $32,200) so that what lands in your pocket after tax still covers the year's need — an approximation: it assumes no other income, no state tax, and a flat bridge-period return of 0% real, the conservative choice for years this close to retirement.
Healthcare before 65 assumes about $18,000/yr with ACA marketplace subsidies — after the 2026 subsidy rollback, an unsubsidized household could see this run considerably higher. From 65 to when guaranteed income starts, it assumes Medicare at about $13,000/yr.
Ready to check if you can ease off?
The one-page “Can I Ease Off?” checklist: seven conditions, and how to check each one against your own numbers.
This calculator is general education, not individualized advice — it shows arithmetic under the assumptions you enter, not a forecast or guarantee.
Run your own numbers.
The Retirement Stress Test is free. Your numbers, three claiming strategies, one honest answer.
Fair questions
Is this financial advice?
No. It's an educational model. It shows arithmetic under assumptions you control — it never recommends an action, and nothing here is individualized investment, tax, legal, insurance, or healthcare advice.
What's the example in the workbook?
A worked example — a fictional composite couple, both 62, retiring with $840,000 — ships pre-loaded so you can watch the method run before you enter anything. Every input sits in an EXAMPLE column; type your own numbers beside it and switch to Your Numbers.
Does it work in Google Sheets?
Yes. The workbook uses only formulas that survive Google Sheets import, and instructions are on the first tab. It also opens in Excel and Numbers.
What happens to my email?
You get the download and The Saturday Ledger, our weekly letter. We never sell or rent the list. One click unsubscribes.
Why is it free?
It’s a byproduct — we build this model for every episode anyway. How the company actually earns money is published here: /how-we-make-money.